This is the third and final part of a series of blog posts related to limiting tech debt in Base iOS app. Take a look at the first part and the second part if you like.
Why bother?
Base iOS client version 3.5.2 is a build number 2259. Base 2.3 from January 2013 was a build number 270. Roughly 2000 builds in 5 years means roughly 8 builds every week, and if you won't optimize it to be a streamlined task, it can become a painful experience.
Other than just automating release builds, you might want to perform regular health checks of your project. Continuous integration helps in that by running unit tests and/or automated UI tests suites. But it can be additionally upgraded to collect some interesting data while already making builds.
Common tools
We recently adopted fastlane to automate various tasks around our codebase. I'm not sure if it requires an introduction, but if you were living in a cave just like me, fastlane is a modern, good-looking automation tool, written in Ruby and developed very actively all the time. Not only it contains a great number of built-in actions but it also allows you to define your own actions or plugins that nicely integrate into it.
We run continuous integration using Jenkins, but that's not sexy at all so I'll just stop here by saying that we configured Jenkins jobs such way that they simply call fastlane to do all the heavy-lifting.
Uncommon tools
What's perhaps more interesting, is that while we're running CI tasks we also gather additional information about the build, like the duration, warning count and code coverage stats. We store that information in InfluxDB – a lightweight time series database with HTTP API. We then visualize the data with Grafana. What is very important – both of these tools are available for free when you self-host them so you can give them a spin any time, and I recommend it. I personally run them at home on my RaspberryPi and use them for some cool stuff.
AppStore release builds
Let's have a look at the list of AppStore release chores for Base App:
- sync submodules
- install pods
- set desired build version
- update build number (check HockeyApp for the latest beta/RC build number and increment it)
- go to iTunesConnect; create a new app version
- go to Xcode; select AppStore scheme
- build and archive
- upload to iTunesConnect
- locate the Xcode archive
- compress debug symbols
- upload debug symbols to HockeyApp
- compress the whole Xcode archive
- upload the archive to Dropbox
It could take around 60-90 minutes to do all these things, possibly a little less if you focus solely on the release job. I mean, while waiting for a release build to compile, and then for various uploads to finish, you oftentimes decide to start a side task in the meantime (like a small bugfix, testing, documentation, facebook, etc.) that you'd still have to interrupt shortly in order to follow up with the release. In case you forget you were releasing an app, the process could extend up to a whole day...
Let's try to eliminate the human factor. The list of AppStore release chores for Base when using fastlane:
- call
bundle exec fastlane submit version:X.Y.Z - There's no point 2.
Oh, and it also fetches the most up-to-date certificates from Apple Developer Portal, I forgot about it because it just automagically happens while I'm moving on to other tasks of the day.
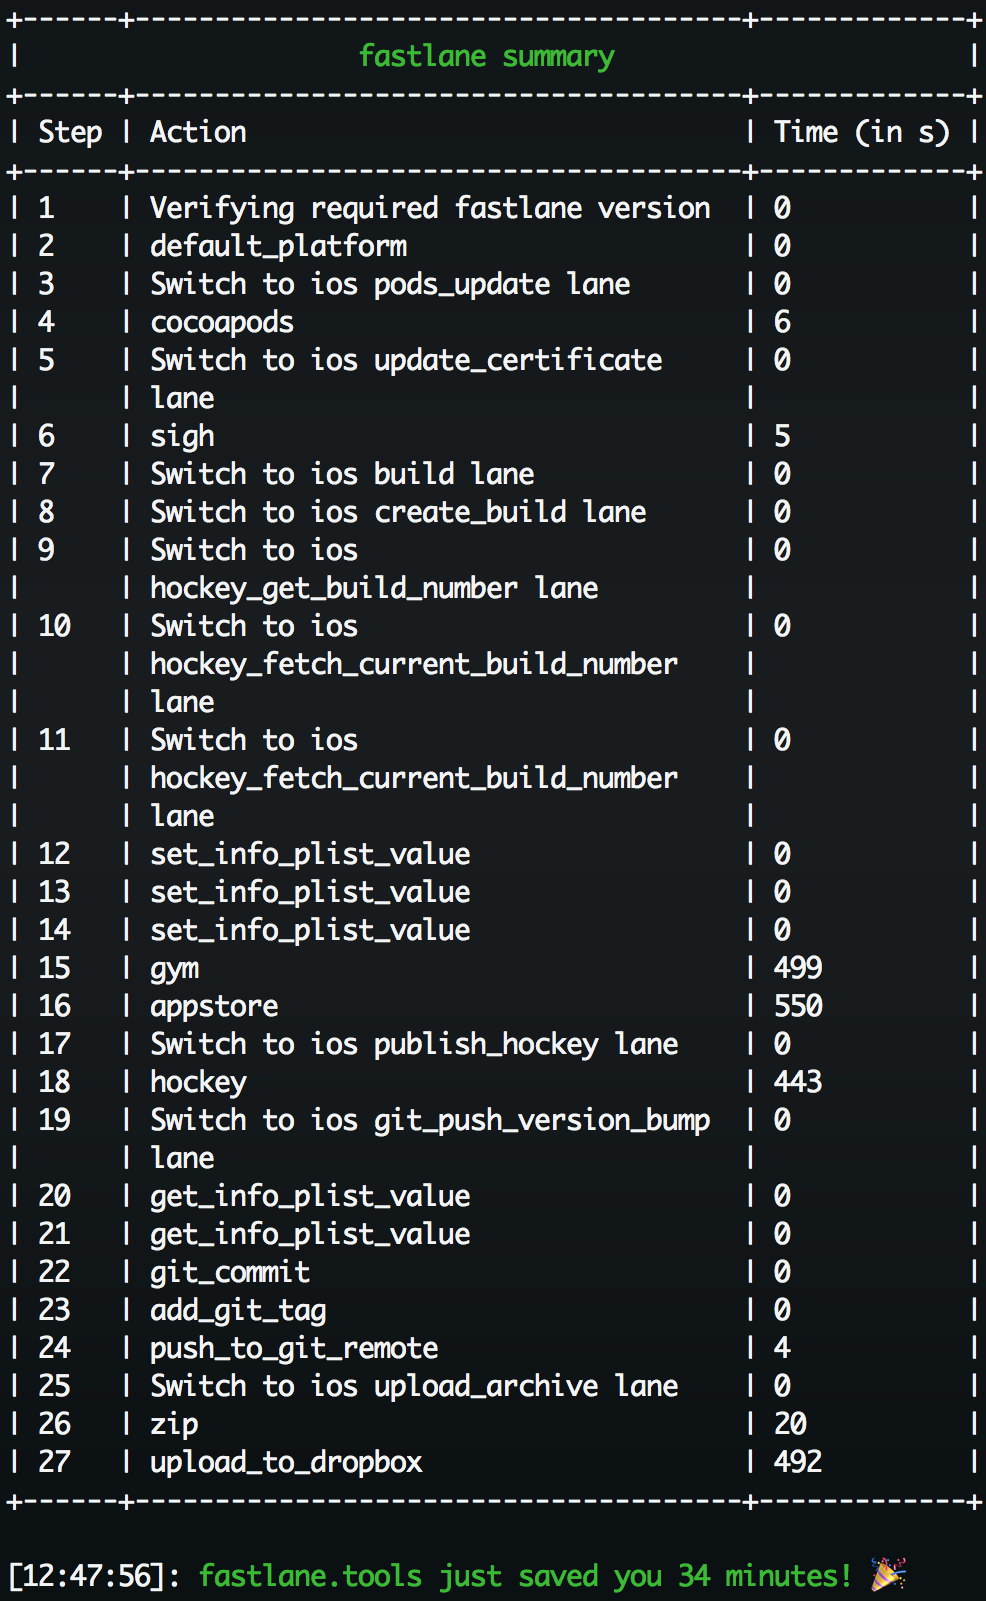
34 minutes? Not bad for a release build and uploading over 300MB of data (ipa file, dSYMs + Xcode archive) on my home internet connection. And all that happened while I've already been ~33 minutes into my next tasks*. 🚀🚀🚀
Yes, such a release lane (as fastlane calls its user-made scripts) doesn't come bundled with your copy of fastlane and you'd have to implement it yourself, but most of the time it's just a matter of using built-in fastlane actions with an occasional Ruby scripting**. Surely a doable thing and definitely worth the effort as it pays off quickly.
For what it's worth, I published a fastlane Dropbox plugin that you might find useful if Dropbox is part of your release flow (or any other flow you'd want to automate for that matter).
[*] – Pro tip: it's a good idea to have another copy of your repository for creating AppStore builds (and for other automated tasks in general). This way you're not blocking your working copy of the repo with fastlane run, so you can freely switch branches, etc.
[**] – If you're allergic to Ruby, you can also write your Fastfiles in Swift! Read here for more info.
Preparing beta builds
There are significantly fewer steps to complete in order to create a beta build for HockeyApp – and these are a subset of the AppStore lane, so with minimal modifications, we got that case covered too. And even though we used to have a custom-made script for preparing beta builds, being able to replace it with fastlane was very relieving, as it's one thing less to care about.
Automated unit testing on CI
The elementary task for continuous integration is building the app and running unit tests. With fastlane, it's as easy as calling its scan action, e.g. like this:
lane :unit_tests do
    scan(scheme: "Example")
end
It cleans the project, builds the app for testing and runs tests suite. It's widely configurable, so if you're new to fastlane, take a look at the documentation for detailed info on scan. For our case, provided that we prepend it with submodule update and pods install, we'd be good to go, only having to direct Jenkins to fastlane's output files.
Tracking build duration and warning count
We were setting up fastlane for Jenkins just at the time of our warnings crusade, so we wanted to keep clear visibility into what's the current warning count and whether pull requests introduce any new warnings. We also gave it a shot with measuring CI build time – although completely unrelated to the local build time (our iOS CI runs on Mac minis that are OH SO SLOW), and prone to significant variations (dependent on the current load of the given Jenkins slave), it could still give some value to us.
Since scan can't build without running tests, and that's what we needed for measuring build time, we had to use a lower level xcodebuild action. The flow is as follows:
- update submodules
- install pods
- clean the project using
xcodebuild - record current timestamp:
build_duration = Time.now
- build the project for testing using
xcodebuild - store build duration using the recorded timestamp:
build_duration = Time.now - build_duration
- extract warning count from the log file:
warning_count = File.foreach(build_output_path)
                  .grep(/: warning:/).uniq.count
- extract build number and version from
Info.plistfile - submit data to InfluxDB:
influx(
    tags: {
        branch: git_branch,
        build_number: current_build_number,
        version: current_version_name
    },
    values: {
        build_duration: build_duration,
        warning_count: warning_count
    }
)
Influx tags can be used later on to filter presented values.
- eventually, run tests :) using
scan - generate code coverage report using
slather, but only on the master branch, because it takes a significant amount of time and we don't want to do it for every update to every pull request.
Visualizing data
The data stored in InfluxDB is retrieved by Grafana to be visualized as graphs and/or tables:
[caption id="attachment_379" align="aligncenter" width="1392"]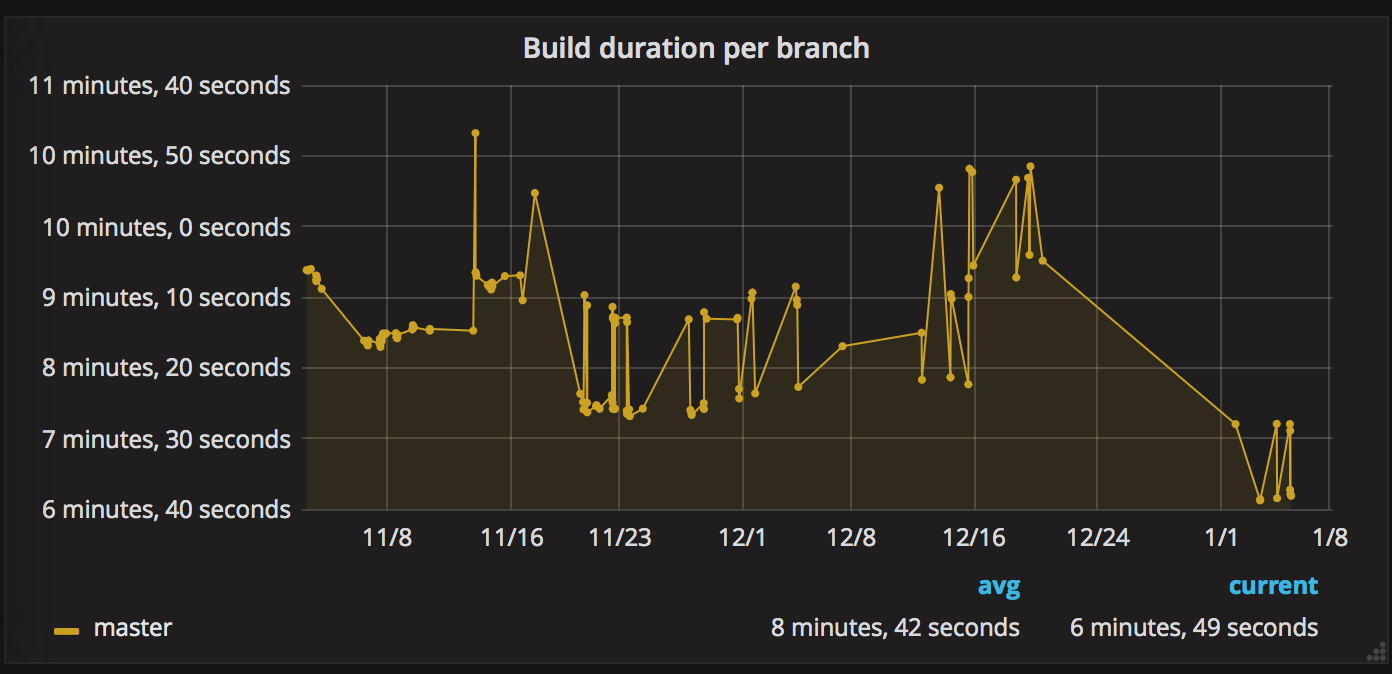 This must be called a locally consistent data.[/caption]
As you can see, the build duration may differ wildly on the CI server, even for two builds done next to each other. But one could argue that after neglecting the spikes you can observe some kind of a trend line, and it doesn't even have to go down to indicate our build time optimization effort, because:
- we set up Grafana only close to the end of the build time optimization effort,
- we have been adding more code to master branch all the time, so it must have required more time to compile.
On the other hand, the warning count graph does the job perfectly:
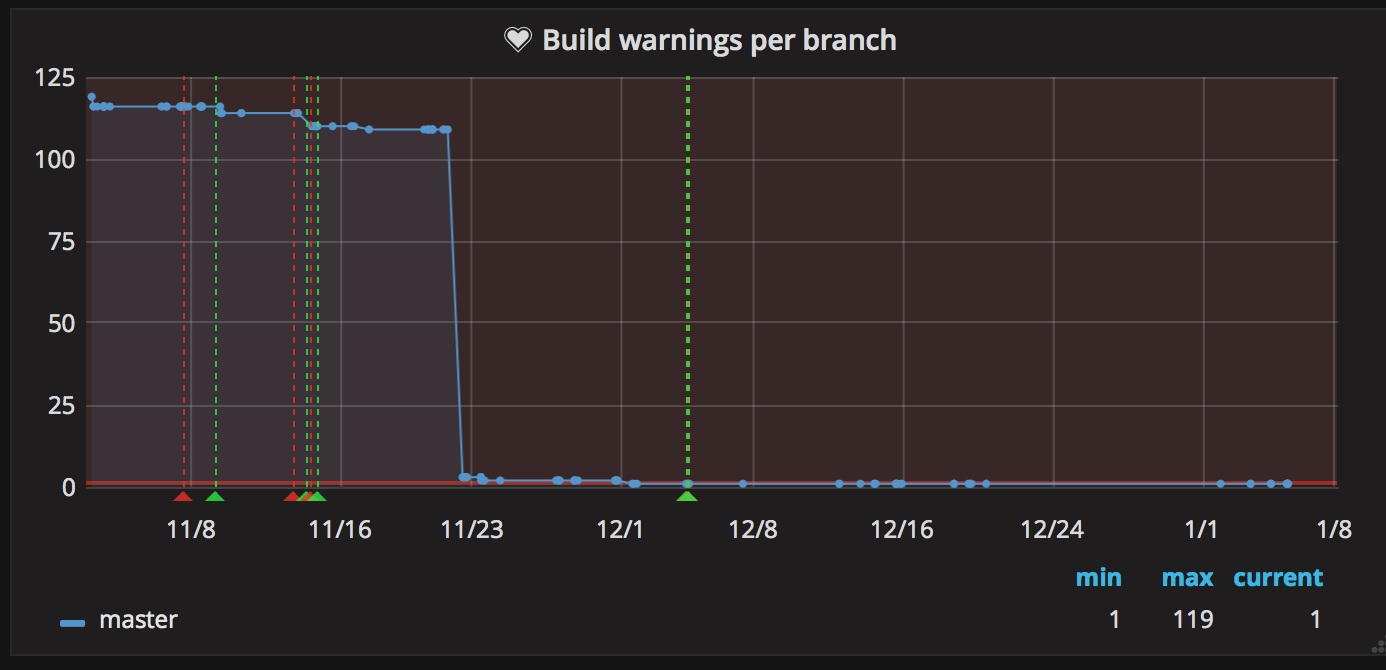
You can see the build warnings count on master constantly getting lower, and the rapid slope around 20th of November is the merge of UILocalNotification rewrite – our last huge build health offender.
Also, notice the heart to the left of the graph title. It signifies that the alerting is enabled for this graph. It's configured so that whenever a data point with warning count greater than the current master occurs, it posts a notification to our HipChat room:
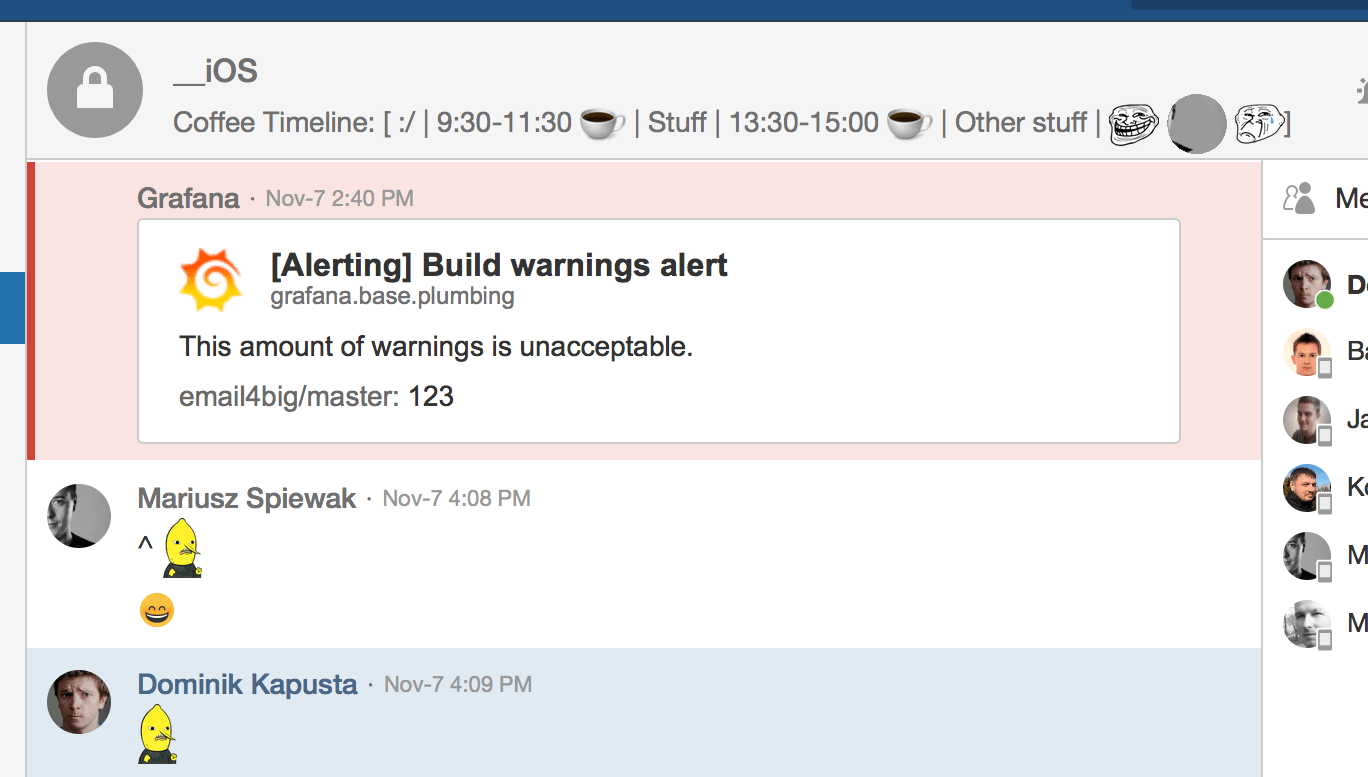
This way the right person could be blamed instantly ;)
Our whole Grafana dashboard is still a work in progress. Although it's pretty messy without additional filtering and with 2-month time span, you can easily filter by time range, branch, user or version to get the insights you're interested in:

As a bonus, at the very bottom, there's a graph of the duration of local Xcode development build done by developers while working (when in the office, because our InfluxDB server is inaccessible from the outside). It uses custom Build Phases of Xcode project to mark the beginning of a build and compute the duration, and then reports the time alongside some metadata to InfluxDB.
The goal here was to get an idea on how long the average build (no matter clean or incremental) takes, and well, the number is close to 30 seconds, but I'm not quite sure what to do with it now. It's not actionable because the value is acceptable, given the big amount of code. I'd probably try and rework the script to calculate only clean build times.
We also kind of hoped to get the proof that new MacBook Pro compiles significantly faster and so the whole team needs an upgrade, but it doesn't seem to be the case this time ;)
Recap
Automating common tasks around our codebase was the last remaining task of dealing with increased tech debt. During last two months, we resolved almost 400 warnings, reduced build time by half, started saving some significant amount of work time by offloading common tasks to the appropriate tools and gained much better visibility and control of our codebase health. The work is not by any means finished, but it has actually only started. However, after such a solid initial effort, following up will be much easier.
Thank you for reading through, and I hope it wasn't a total waste of time!