If I told you Base iOS client takes around 3.5 minutes for a clean build on a decent MacBook Pro (Mid 2015) you would probably say it's not that bad, considering around 2000 classes and 30+ cocoapods. However, since we haven't ever worked specifically on build time optimization, we surely could do something to cut it down a bit.
This is the second part of a series of blog posts related to limiting tech debt in Base iOS app. Take a look at the first part if you like.
Measuring build time
To start with, let's display total build duration in Xcode. Typing the following in terminal:
$ defaults write com.apple.dt.Xcode ShowBuildOperationDuration YES
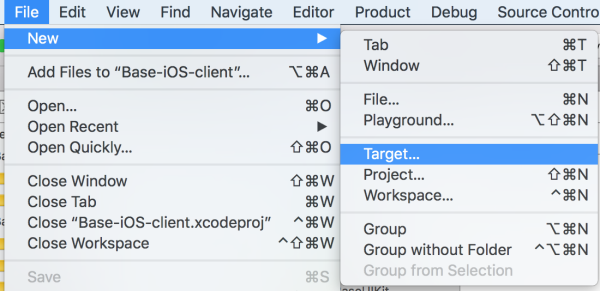
and restarting Xcode will get you the build time in Xcode's toolbar after every build. Just like this:

Apparently, it's an undocumented and unofficial feature that is subject to stop working with any future Xcode release, but so far it's been serving developers since at least Xcode 5 (according to this discussion on SO). The downside is that duration retrieved this way can't be logged to a file or exposed in an environment variable, but it's perfect for controlling the build time as you work on improving it.
Improving build time
Having set the benchmark, you can go through the list of things that can be applied to every project in the pursuit of faster build times.
Look for unused code
As silly as it may seem, your project can contain code that is either no longer used, or obsoleted by new APIs that can do the same but behind the scenes, and also possibly faster. This is true especially the bigger and older your codebase is.
The same holds for external dependencies like cocoapods. Sometimes you stop using a helper library (e.g. UIAlertView+Blocks obsoleted by UIAlertAction) and you forget to remove it from Podfile. It really can happen if the Podfile is long enough ;)
Spot potentially obsolete dependencies
Sometimes you can get rid of a pod because iOS SDK finally implemented the missing functionality (e.g. local notification banners can now be displayed while your app is in foreground, which in most cases looks better than third party toast views).
For the reasons mentioned above, we were able to remove 6 pods out of 37 we've originally used – that's a lot less to compile.
Debug Swift compile time
If you suspect that your Swift code takes too long to compile you can verify it by adding the following Swift compiler frontend flag to Other Swift Flags section in build settings:
-Xfrontend -debug-time-function-bodies
It causes the compiler to output to the build log the time taken to compile each Swift function, just like that:
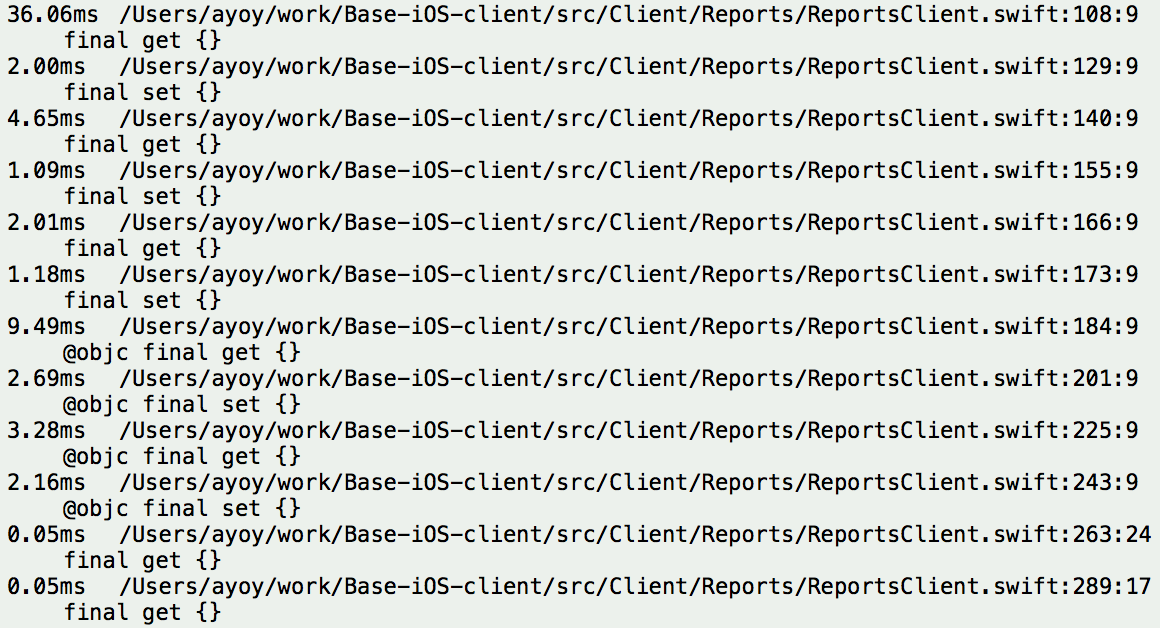
But you don't really have to go through the build log to investigate compile times one by one. Here comes the other useful frontend flag:
-Xfrontend -warn-long-function-bodies=150
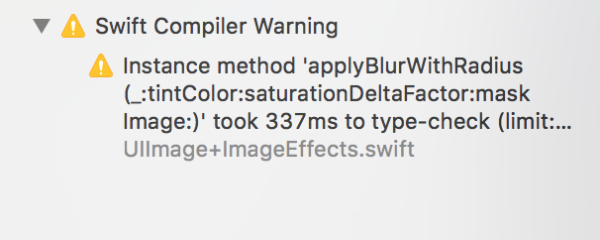
Setting this flag will generate a build warning for every method that takes more than 150ms to type check. The time limit is obviously just an arbitrary value and you can fine tune it to suit your needs.
Finally, there's a handy app by Robert Gummesson that extracts compile times from the build log and displays them in a searchable table view:
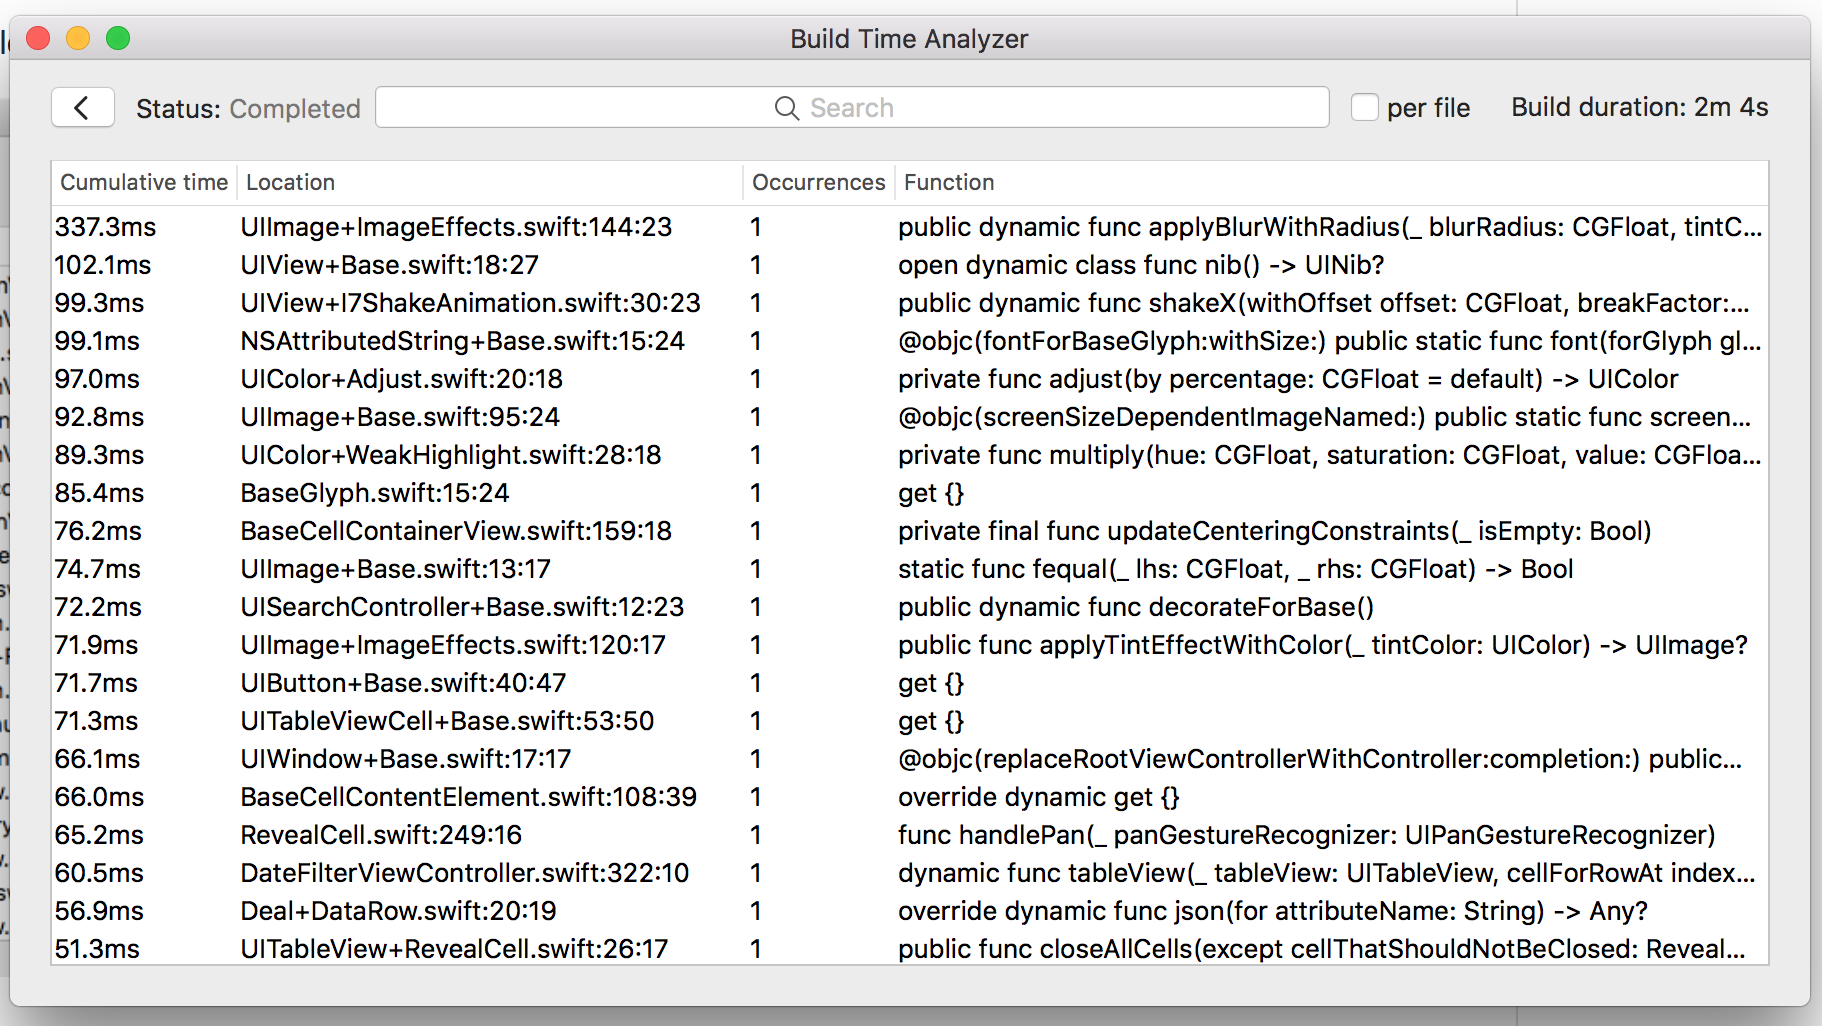
Be sure to check it out and read his two blog posts mentioned in the Readme file for more info on compile time problems he was able to debug and fix.
My personal feeling though is that Swift compiler has greatly improved between Swift 2 and Swift 3 and the weirdly long compilation times should be gone now. At least we haven't really experienced unusual slowness in our Swift 4 codebase.
Experiments with optimization
The whole module optimization provided by Swift compiler is a perfect way to reduce the binary size and speed up execution time for release builds. It can also greatly improve compile time, which is not clearly stated in the WMO blog entry at swift.org.
It is, however, a release build feature and enabling it for debug builds would make debugging virtually impossible. Unless you do it like Cookpad does.
Yusei Nishiyama from Cookpad gave a very inspiring talk at Mobilization 2017 on how they handle development of an iOS app with 100 million monthly active users. He talked about enabling whole module optimization for debug builds to speed up compilation.
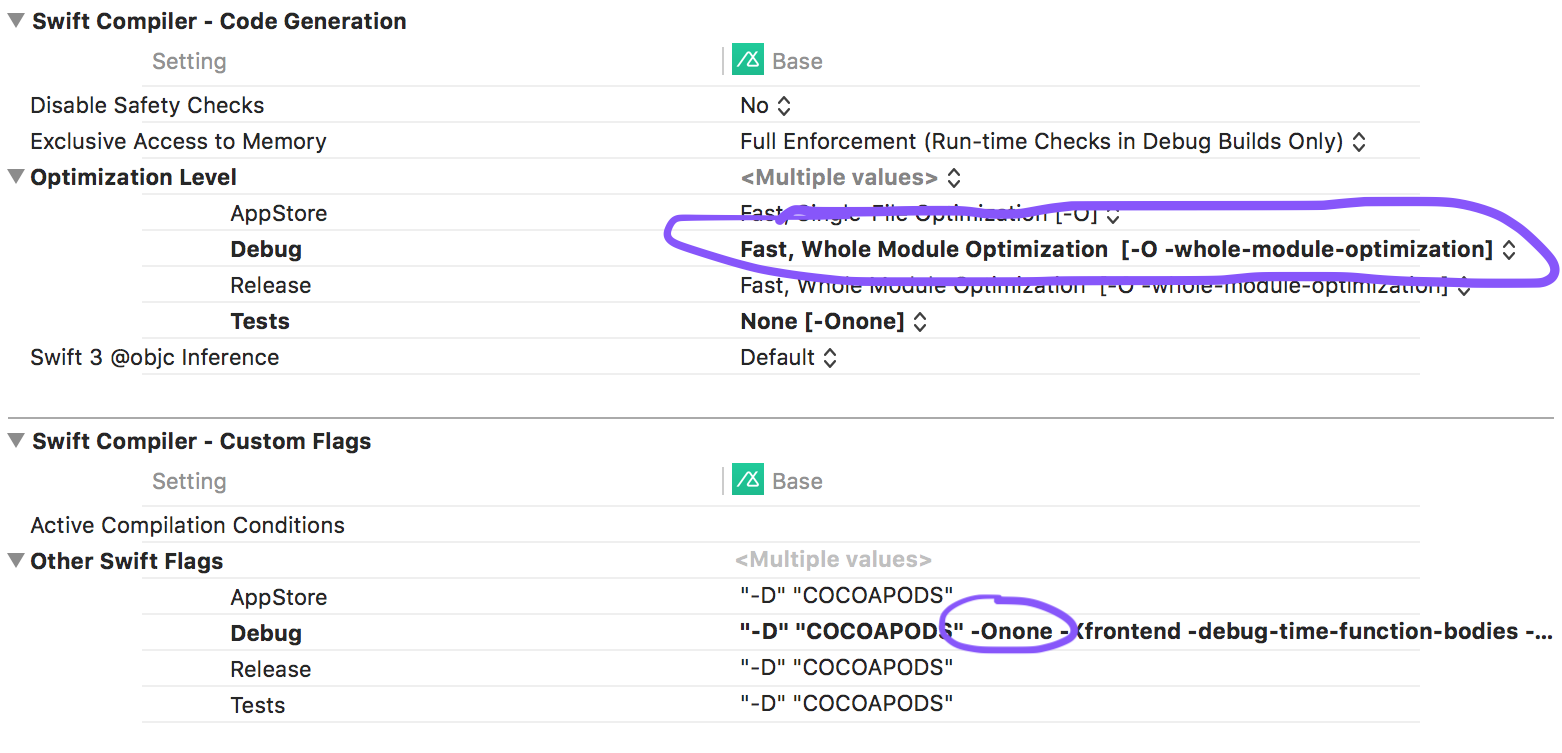
First, you need to enable WMO in Swift Compiler's Optimization Level build settings (which effectively appends -whole-module-optimization flag), and then disable optimizations using -Onone in Other Swift Flags (which doesn't seem to be affecting the WMO flag). Simple as that.
Here are build times for a clean build of Base app with different optimization levels:
None [-Onone]: 184s
Fast, Single-File Optimization [-O]: 190s
Fast, Whole Module Optimization [-O -whole-module-optimization]: 123s
As you can see, enabling WMO makes compilation faster by a factor of 1/3, which is a huge improvement.
Modularizing the code
This is not the simplest task ever, especially if you don't apply it from the start of the project. Still, it's a great idea to extract files that:
-
[caption id="attachment_329" align="alignright" width="300"]
 Creating a new Swift module, step 1.[/caption]
have no dependencies on Obj-C code,
- have no dependencies on other Swift files, or all their dependencies are extracted together with them,
to form separate binaries linked with the main application's Swift module. This has a couple of advantages:
- clearly defined responsibilities – a module, by definition, groups the APIs that have similar purpose; creating a helper module that does X, removes that X from the main module responsibilities list,
- better control of the API visibility – you can use
open(accessible and subclassable),public(accessible but not subclassable), andinternal(not accessible outside a module) access specifiers for all the definitions within a module. - reusability – it's very simple to copy the whole module between projects and use it elsewhere.
- open sourcing – once you've prepared a small, self-contained Swift module, you might want to contribute it to the Open Source community,
- incremental build time improvement – while the clean build time would remain pretty much unchanged (with a sane number of modules at least), every incremental build won't touch already compiled modules unless their source has changed. This means fewer files to recompile with every change to the code, and eventually, faster build time.

We created two modules within Base, and I believe the same could be a valid choice for most projects (if you don't have a better idea):
- BaseUIKit – containing all the common UI extensions plus simple UI classes like custom cells and UI controls,
- BaseToolkit – with various helper classes and extensions that are self-contained.
For a proof of concept, modules are 10-20 classes each and around 3500 lines of code in total, but we'll be adding new code there or migrating old code from the main module as time permits. The whole module optimization can (and should!) obviously be enabled on them like I described above.
Outcome
Going through all the ideas I described and taking appropriate actions, we were able to reduce the clean debug build time by nearly 50% (while adding some new code since October, as I'm writing this in January and testing with Base v3.5.0).

The Jenkins build duration went down from over 12 minutes to below 8 minutes. More insights on that, plus how we're using fastlane to automate various tasks are coming up in the last part of the series. Subscribe to the blog if you like, and you won't miss it :) thanks!